PECA: Paired Expression and Chromatin Accessibility modeling
- Version 1.0
- Last updated: April 06, 2017
Reference#
- Zhana Duren, Xi Chen, Rui Jiang, Yong Wang, and Wing Hung Wong. Modeling gene regulation from paired expression and chromatin accessibility data
 . PNAS, Vol. 22, No. 19, pp. 2413-2420, 2006.
Method#
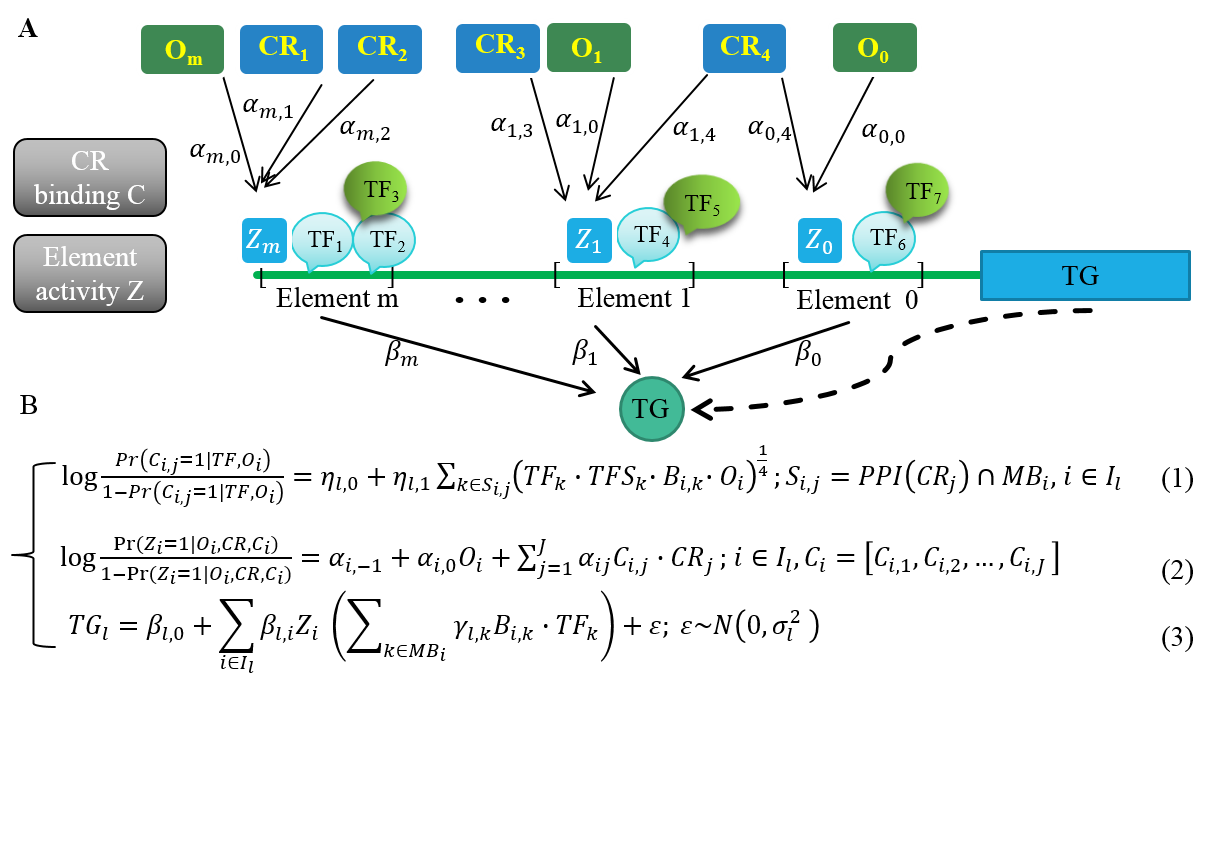
""<img src="http://doc.aporc.org/attach/PECA/Picture1.png" alt="...." style="float: left; margin: 1.0%; padding: 0.5%;">"" Chromatin plays a critical role in the regulation of gene expression. Interactions among chromatin regulators, sequence-specific transcription factors and cis-regulatory sequence elements are the main driving forces shaping context-specific chromatin structure and gene expression. However, because of the large number of such interactions, direct data on them are often missing in most cellular contexts. The purpose of the present work is to show that, by modeling matched expression and accessibility data across diverse cellular contexts, it is possible to recover a significant portion of the information in the missing data on binding locations and chromatin states and simultaneously, to achieve accurate inference of gene regulatory relations.Procedure#
- Step 1: Format the Multiple Microarray Datasets into desired data file (See the attached example file as a reference).
- Step 2: Open the data file by click the 'open' button and browse the data file location.
- Step 3: Choose proper parameters. There are two parameters you can choose by altering the default value. Specifically,
- Lambda: This parameter is used in the inferring algorithm to adjust the sparsity of the structure. The default value is 0.0.
- Threshold: This parameter is used in the control the output file GRN.dot, which can be visualized by the neato tool of the software package Graphviz. The threshold parameter controls the number of the edge whose strength of link is smaller than Threshold not shown in the network graph. The smaller this parameter, the more edges in the network graph. The default value is set to 1e-6.
- Step 4: Computing by click the 'Infer' button when the data file and parameters are ready.
- Step 5: Checking the results. There are two files are output in the same directory with the software.
- GRN.dat: This file records the matrix assessing the strengths of edges of the network, i.e. the element located on the i-th row and the j-th column means the regulatory strength from the j-th gene to the i-th gene, the sign + means the activation and the sign - means repression.
- GRN.dot: This file records the information to output the network structure which can be illustrated by Graphviz. Note that only the edges whose regulatory strength in GRN.dat is larger than Threshold parameter are shown. The software Graphviz can be downloaded from http://www.graphviz.org freely.
Software#
This is a beta version of the program for preliminary testing. The program is still under development.

Category: Software
Add new attachment
Only authorized users are allowed to upload new attachments.
List of attachments
| Kind | Attachment Name | Size | Version | Date Modified | Author | Change note |
|---|---|---|---|---|---|---|
png |
Picture1.png | 130.4 kB | 1 | 07-Apr-2017 05:35 | YongWang |
«
This particular version was published on 07-Apr-2017 05:40 by YongWang.